

One reporter participates in the Statistics’ interactive human Galton Board experiment
In preparation for an interactive experiment, SCHS’s statistics class designed a plan to create the human Galton Board. After discussing the details for the concept of the experiment, the class began creating everything that would be used. While some students cut out strips of purple and green paper or created colored dice, I helped to write the instuctions. Working with three of my classmates, I wrote an explanation for what the participants needed to do: how they would stand at the tip of a large triangle crisscrossed by colored paths, roll a colored dice and then follow the path to keep rolling until they reached a number at the end.
At the start of the most recent unit on distribution, statistics teacher Marlene Spector had introduced my class to the idea of a Galton Board. A Galton Board is a device filled with thousands of small beads and pegs in the shape of a triangle. When tipped over, the beads randomly fall through the triangle and form a bell curve, with most of the data falling in the center and a few outliers. At each peg, the ball has a 50-50 chance of going either direction. The distribution is formed because there are more paths that lead to the middle of the spread than the edges. The bell curve is a visual representation of a Normal Distribution, which data naturally tends to follow.
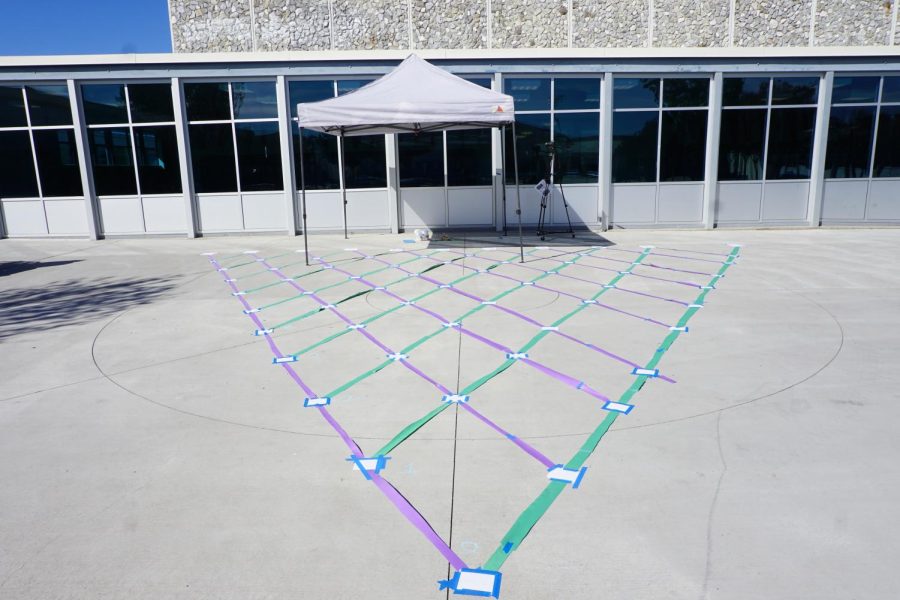
On the day of the experiment, I sat down at a table on the stage in the quad. A triangle, made out of colored paper that mimicked the pegs of a Galton Board, had already been laid out by the previous class. At first, people mainly ignored the set up or carefully walked over the paper lines. As I waited, bits of paper would come untaped and Spector, another student or myself would have to retape them. Eventually, groups of one or two students, usually from statistics, started to come over and walk through the board. Once they finished walking a path and landed at a number, I would place a lego on a stack that corresponded with the number. After a bit, the students would come back with their friends and watch as they walked through the paths. Some people even went through multiple times, attempting to get a 10, the highest number possible.
After lunch, all of the statistics students in fourth period assembled on the stage. Different jobs were assigned to us, including manning the table with the legos, going to different classes to explain the process and retaping the strips of paper that had flown away in the wind. I helped to run people through the board and clear up confusion about the process. I would wait for the class to come over, line up and finish listening to the explanation again, then hand a cup with a colored dice to the teacher and run them through the process. By and large, the teachers were excited about the experiment. Seeing the teachers run through the process helped to clear up any confusion and win over hesitant students.
About half way through the period, I visited science teacher Sara Carvalho’s class with a few other students to explain the process. I read from the prepared script and then we re-explained the parts that people seemed confused about. Then, I brought them outside and repeated what I had been doing before. This continued until just before the end of the period, when we ripped up the paper board.
Over both lunch and fourth period, over 200 students went through the human Galton Board. Though there was still variation within the final data, the large sample size ensured that the final distribution was as close to a Normal Distribution as possible. Beyond simply proving that data follows a Normal Distribution, this experiment helped to spark conversations with students not enrolled in statistics and add an interesting hands-on experience to the class.